Proving that your muscles need these proteins
Inferential statistics with SPSS to test hypotheses of a scientific research project,
dealing with small sample sizes and behavioural time-series data without normal distribution
The following description includes just a small, simplified version of my analyses, but you can download the entire PhD research in the Key insights section if you are curious :)
The research task
What is the cause of muscular distrophies? Many diseases in which the muscle tissue stops working properly are still a mistery in terms of the alterations that happen at a cellular level.
Our cells need a flexible scaffold called "actin cytoskeleton" to keep their internal structure. In the contact points between nerves and muscle fibers, this scaffold controls where and how different cellular elements are organized so that our muscles receive the signal to contract. This includes a delicate balance between keeping cellular elements on the surface of the muscle fibers or recycling them internally, depending on the cell needs. When these functions are impaired, different neuromuscular diseases can arise, some of them with fatal consequences for the patient.
There are two proteins, called drebrin and myosin VI, that had been previously described to interact with the actin cytoskeleton. They were never studied in the muscle, and I hypothesized they were very important for the communication between nerves and muscles. How can we test this hypothesis? Answering these questions:

What happens to the muscle if we genetically remove the possibility of creating any of these proteins?
Is the contact point between nerve and muscle normal if any of these proteins doesn't work?
Can animals move normally if they lack any of these proteins in their muscles?
Key insights
Drebrin protein is neccesary for the correct arrangement of elements on the muscle surface that lead to its contraction.
These are muscle fibers grown on a Petri dish.
They are basically elongated cilinders that grow together
(and, in your body, millions of them group to build your muscles)
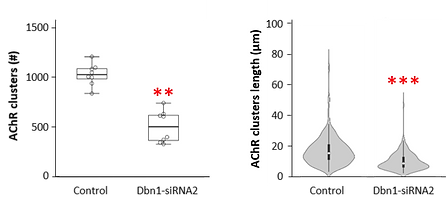
If we genetically remove the production of drebrin protein (called Dbn1-siRNA2 in the image below),
the muscle fibers form many less clusters.

When a neuron contacts them, they produce receptors called AChR that aggregate in these white clusters
all over the surface of the fiber
Let's look at the data!
*

I counted the total number of clusters that fibers were able to form (left graph), but also the length of each of them (right graph).
this symbol means the difference between groups were big enough to confirm the hypothesis
Graph 1: The first variable (total number of clusters) is composed of discrete numerical values (= numbers from 0 to 1,200) that did not follow a normal distribution, as proven by the Shapiro-Wilk normality test: P = .05. Therefore, I had to use a non-parametric test of independent samples called Kruskal-Wallis U test to show that the Control and the Dbn1-siRNA2 fibers were objectively different. And they are!
Graph 2: The second variable (length of each cluster) is also composed of discrete numerical values (ranging from 2.26 to 70.81). Because the overall length was not statistically significant, but I could see a difference in their distribution (look at the grey violin shapes), I classified them in short, medium, and long clusters (in statistics, these are called nominal values). To compare how many of each of these classes are in the Control vs. Dbn-siRNA2 fibers, I used a Chi-Square test.
Myosin VI protein is neccesary for the strength of leg muscles only in females, but not for their arm muscles.
Myosin VI is genetically mutated (and doesn't work) in a strain of mice called SV. To know if they have the same muscle function than normal mice, I used a device called grip strength test, that measures how much force from the researcher is necessary to make the mouse release its grip from the metallic bars (don't worry, mice are not hurt during this test).
The variable measured by the device is composed of discrete numerical values (ranging from 22-304), but the experiment was performed on each animal 3 times (trials 1, 2, and 3) and the animals could be grouped by sex (female or male) and by their experimental group (Control or SV).
The statistical test required for analysis of variance of 2 inter-subject factors (sex and group) and 1 intra-subject factor (trial) is a repeated measures ANOVA.
Can you spot where the differences between Control and SV were statistically powerful?
STATISTICAL METHODOLOGY
All statistical analyses were performed using IBM SPSS Statistics 22.0 (SPSS Inc., USA) and the results were graphically represented using the online Interactive Dotplot data visualization tool.
-
Results were considered statistically significant when P ≤ .05, and represented as *, **, or *** when P ≤ .05, P ≤ .01, and P ≤ .001, respectively.
-
Shapiro-Wilk normality test was used to test the null hypothesis of normal distribution required for parametric statistics.
-
When the normality test was statistically significant (i.e. the dataset did not follow a normal distribution), an appropriate non-parametric test was used (independent samples Mann-Whitney’s U or Kruskal-Wallis’ U tests).
-
When the normality test was not statistically significant (i.e. the dataset followed a normal distribution), two-tailed independent Student’s t-test was used to test differences between two experimental groups with continuous data that fulfilled assumptions for parametric tests.
-
-
Chi-Square test was used to analyze nominal data that was manually divided in classes, in order to compare relative frequencies of each class in different experimental groups.
-
Repeated measured two-way ANOVA, with 2 inter-subject independent variables (sex and genotype) and 1 intra-subject variable (trial), was used to analyze differences in the grip strength test of control and experimental mice.
-
When post-hoc tests were necessary, a restrictive post-hoc test (Bonferroni correction) was used to limit the possibility of getting a statistically significant result when testing multiple hypotheses (control for type I error inflation).

